
The blog · Credit mechanics
A Bank Made of Glass: The Business Development Company Masterclass
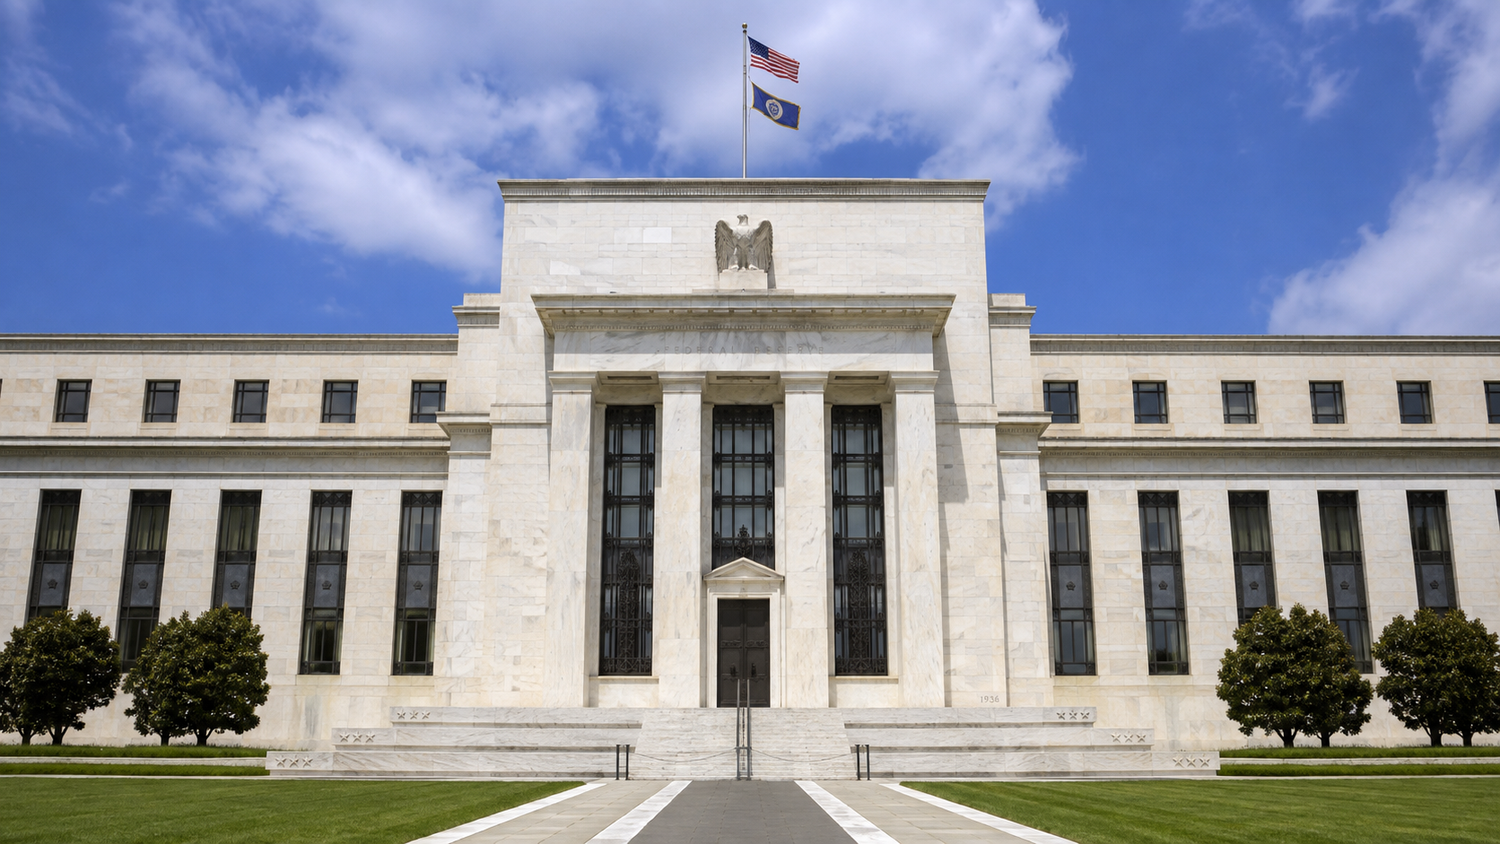
A bank will not show you its loan book. You can own shares of the largest lenders in the country for decades and never learn the name of a single borrower, the rate on a single loan, or which credits the workout team is quietly nursing. You are asked to trust the reserves, the ratios, and the management, and mostly that trust is honored, but it is trust all the same. The loan book itself sits behind frosted glass.
There is one kind of lender in the public markets that operates with the glass removed. A business development company publishes its entire portfolio four times a year: every borrower by name, every instrument, the rate and its spread, the maturity, what the company paid for the position, and what it now claims the position is worth. Every loan that has stopped paying is flagged. Every dollar of interest that was promised on paper rather than paid in cash is disclosed. The fee the manager takes is spelled out to the decimal, along with the formula that produces it.
That transparency is a gift, and almost nobody unwraps it. BDCs are bought overwhelmingly on one number, the dividend yield, which is precisely the number the disclosures exist to let you interrogate. So this piece is a masterclass in the interrogation. We are going to teach you how the machine works, from the Federal Reserve's target range all the way down to the footnote on a single loan, and then we are going to read three real filings together and let them disagree with each other.
Our three specimens all filed a Form 10-Q for the same quarter, the three months ended June 30, 2026, so every number that follows is drawn from the same moment in time. Ares Capital Corporation, ticker ARCC, is the largest BDC and one of the longest-lived, public since 2004; it will serve as our teaching skeleton. Blue Owl Technology Finance Corp., ticker OTF, is a software lender that came to the public market in mid-2025 and now trades at a spectacular discount that we will argue is no bargain at all. And PhenixFIN Corporation, ticker PFX, is the strangest of the three, a BDC that earned two dollars and fifty-one cents per share of net investment income over nine months and paid its shareholders seven cents. One quarter, three very different animals.
| As of June 30, 2026 | ARCC | OTF | PFX |
|---|---|---|---|
| Portfolio at fair value | $29.3B | $14.7B | $302M |
| Portfolio companies | 619 | 205 | ~31 |
| First lien loans, % of portfolio | 59% | 78% | 40% |
| Net asset value per share | $19.35 | $16.48 | $81.69 |
| Share price ÷ NAV | ≈0.96× | 0.63× | 0.52× |
| Loans on non-accrual (cost / fair value) | 2.4% / 1.4% | 0.6% / 0.1% | 2.3% / 0.0% |
| Weighted avg. yield, income-producing assets | 10.3% | 9.6% | 13.2% |
| Management | External (Ares) | External (Blue Owl) | Internal |
Hold that table loosely for now. By the end of this piece, every row in it will mean something to you, and the two enormous discounts at the bottom of the price column will have two entirely different explanations.
What a business development company actually is
A business development company is not a company in the ordinary sense. It is a wrapper: a set of legal elections layered on top of a pool of investments, created by Congress in 1980 as an amendment to the Investment Company Act of 1940. The problem Congress was trying to solve has a familiar shape. Small and mid-sized American companies, the kind too large for a local bank and too small for the bond market, were starving for capital, and the existing fund structures were built for buying stocks, not for making loans. So Congress built a vehicle designed to lend to them, and, crucially, designed so that ordinary public investors could own a piece of the lending.
The election comes with real obligations. A BDC must keep at least 70 percent of its assets in qualifying investments, which broadly means securities of private or thinly traded American companies, and it must offer to provide managerial assistance to the companies it finances. It reports to the SEC like any public company, files quarterly and annual reports, and, unlike a private credit fund, anyone with a brokerage account can buy it for the price of a share.
The event that made the wrapper matter arrived almost thirty years later. After the financial crisis of 2008, regulators required banks to hold more capital against risky corporate loans, and the banks responded rationally: they retreated from exactly the middle-market, leveraged lending the BDC was designed for. An enormous business migrated out of the banking system and into private credit funds, and the BDC became the public market's window into that migration. When you buy a BDC today, you are buying a slice of the direct-lending industry, with the loan book printed in the back of the filing. ARCC's book alone is $29.3 billion spread across 619 companies. The scale is bank-like. The disclosure is not.
The regulatory bargain: the 90 percent rule
Here is the trade that defines everything downstream, including the dividends that attract most BDC investors in the first place.
A normal corporation pays tax on its profits, and then its shareholders pay tax again on the dividends. A BDC can escape the first layer entirely by electing to be treated as a regulated investment company, a RIC, under Subchapter M of the tax code, the same election mutual funds use. The price of the election is distribution. To keep RIC treatment, the company must pay out at least 90 percent of its investment company taxable income to shareholders each year. Miss the test and the corporate tax layer comes crashing back. There is a second, softer screw as well: a 4 percent excise tax applies unless the company distributes at least 98 percent of its ordinary income and 98.2 percent of its capital gains each calendar year, which is why most BDCs pay out essentially everything and some deliberately pay the small excise toll to hold a buffer of undistributed income, called spillover, as insurance for leaner quarters.
Notice the precise wording of the bargain, because one of our case studies turns on it. The 90 percent rule binds taxable income, a figure computed under tax accounting, not the net investment income you see in the financial statements, which is computed under GAAP. The two usually rhyme. They are not the same number, and nothing in the law says they have to be close. A BDC whose taxable income is small can pay a small dividend, or nearly none, while remaining a BDC in perfect standing. The wrapper compels a payout ratio, not a payout. Every investor who treats the letters B-D-C as a promise of double-digit yield is trusting an inference the statute never makes. We will meet the counterexample in section thirteen.
The machine: borrowed money, lent dearer
Strip away the regulation and a BDC is the simplest business in finance. It raises equity from shareholders, borrows additional money on top, lends the combined pool out at a higher rate than it pays on the borrowings, and the difference, after the manager and the expenses are paid, is net investment income, which the 90 percent rule then pushes out the door as dividends. Assets yielding roughly ten percent, liabilities costing roughly five, a spread in between: that is the entire engine. Everything else in this masterclass is a refinement of one of those three numbers.
Because the engine runs on leverage, Congress put a wall around it. A BDC must maintain asset coverage of at least 200 percent, which is a lawyer's way of saying total assets must be at least twice total debt: for every dollar borrowed, a dollar of shareholder equity beneath it. In 2018, the Small Business Credit Availability Act loosened the wall for companies that opt in, cutting the requirement to 150 percent, which allows roughly two dollars of debt for each dollar of equity. Opting in takes either a shareholder vote, effective immediately, or a board vote, effective only after a full year passes, a statutory cooling-off period that gives shareholders time to sell if they dislike the added risk.
Our three specimens sit at three different points against that wall. ARCC opted down to the 150 percent requirement back in 2019 and reported asset coverage of 186 percent this quarter, comfortably inside its limit and levered at roughly one dollar of debt per dollar of equity. OTF reported 203 percent against the same 150 percent requirement, targeting leverage of 0.90 to 1.25 times equity. And PFX is still governed by the original 200 percent wall, reporting coverage of 207 percent, a few points of headroom; its board approved the drop to 150 percent on May 4, 2026, which under the one-year rule takes effect May 4, 2027. When you see a BDC's asset coverage in a filing, you are reading how much room remains between the machine and its legal limit, and how much of the equity cushion would have to burn before lenders, who sit ahead of you, start making the decisions.
One more structural note before we turn to rates. The borrowings themselves are worth a glance in every filing, because they are a mix: revolving credit facilities from banks, unsecured notes sold to bond investors, and securitizations of the loan book itself. PFX even has a small exchange-traded note, its 5.25 percent notes of 2028, which trade on NASDAQ under the ticker PFXNZ like a stock. The mix matters because it determines how much of the liability side floats when rates move, which brings us to the question this entire asset class hangs on.
Where the rate comes from: the Fed and SOFR
Open any BDC's schedule of investments and you will see the same three letters repeated hundreds of times: a loan priced at S plus 5.25 percent, another at S plus 6.50 percent with a 1 percent floor. The S is SOFR, the Secured Overnight Financing Rate, and it is the water level the entire BDC industry floats on. To understand a BDC's income, you have to understand where SOFR comes from, and the answer runs straight through the building on the cover of this piece.
Start at the top. Eight times a year, the Federal Open Market Committee sets a target range for the federal funds rate, the rate at which banks lend reserves to each other overnight. As we write, that range is 3.50 to 3.75 percent, where the Committee has held it since late 2025. The Fed does not command banks to trade at that rate. It steers them there with two administered rates it controls directly: the rate it pays banks on reserve balances parked at the Fed, and the rate it offers money-market funds in its overnight reverse-repo facility. No lender will accept much less than it can earn risk-free from the Fed itself, so those two administered rates act as a magnet, and the actual traded rate, the effective federal funds rate, settles obediently inside the range, around 3.63 percent lately.
SOFR lives one step away. It is the interest rate on overnight loans of cash collateralized by U.S. Treasury securities, the repo market, and it is calculated by the New York Fed each morning as the volume-weighted median of more than two trillion dollars of actual transactions from the prior day. That last clause is the point of SOFR's existence. Its predecessor, LIBOR, was not a measurement but a survey, a panel of banks estimating what they might pay to borrow, and the estimating turned out to be corruptible; after the manipulation scandals, regulators retired LIBOR and completed the migration to SOFR in mid-2023. Because repo lending and fed funds lending are close substitutes, SOFR tracks the Fed's range nearly one for one. When the FOMC moves its target by a quarter point, SOFR moves by essentially a quarter point, essentially the next day.
Loans, though, are not priced off a single overnight print. They reset off term SOFR, forward-looking one-month and three-month averages derived from futures markets. As of June 30, 2026, one-month term SOFR stood at 3.65 percent and three-month at 3.73 percent, figures we are reading directly out of the footnotes of these filings, sitting exactly where the Fed's 3.50-to-3.75 range says they should.
So when you read that a BDC earns S plus 5.3 percent, read it as two different claims. The 5.3 percent is the price of credit risk, negotiated loan by loan at underwriting; it is the part the manager can defend. The S is rented from the Federal Reserve, and the Fed can take it back. Over the past two years it has been doing exactly that: the Fed cut three times in late 2024 and three more times in late 2025, walking the range down from its peak above five percent to today's 3.50 to 3.75. Every one of those cuts flowed into every floating-rate loan in every BDC in America within a quarter.
Before we leave the question of where the rate comes from, one more window is worth opening, because the forward-looking half of this machinery is usually invisible. Term SOFR, remember, is derived from futures — it is a forecast of the Fed wearing a disguise. A prediction market prices the same question with the disguise off: real-money odds, updated continuously, on what the committee does at its next meeting. Here is that market, live.
However the next vote lands, the plumbing is identical: the decision becomes SOFR, SOFR becomes the loan reset, and the reset becomes BDC revenue. The next section is about what happens when a move arrives.
How rate moves travel through the income statement
The naive model says falling rates are bad for BDCs and rising rates are good, since the assets float. The real model has three complications, and the filings quantify all of them.
First, both sides of the balance sheet float, just not equally. ARCC reports that 71 percent of its investments at fair value bear interest at variable rates. But its borrowings are a blend: the credit facilities and securitization debt float, the unsecured notes are fixed, and ARCC has deliberately swapped many of its fixed-rate note series to floating through interest-rate swaps, a choice that keeps the liability side moving in sympathy with the asset side. The result is that a rate move hits revenue harder than it hits interest expense, but it hits both. ARCC's own sensitivity table makes the netting explicit:
| Change in base rates | Interest & dividend income | Interest expense | Net income impact |
|---|---|---|---|
| Up 300 bps | +$635M | +$355M | +$280M |
| Up 100 bps | +$212M | +$118M | +$94M |
| Down 100 bps | −$211M | −$118M | −$93M |
| Down 200 bps | −$416M | −$236M | −$180M |
| Down 300 bps | −$582M | −$355M | −$227M |
Second, look closely at the down scenarios, because they are not symmetrical. Down 100 costs $211 million of income, but down 300 costs $582 million, not three times 211. The reason is the second complication: floors. Ninety-six percent of ARCC's floating-rate book carries an interest-rate floor, a contractual minimum on the base rate, typically between half a percent and one percent, sometimes higher on riskier credits. Floors are an option the lender owns. They did heroic work in the zero-rate era, when every floored loan paid as if SOFR were one percent while the BDC's own borrowings cost nearly nothing. At today's 3.7 percent SOFR they are far out of the money and do almost nothing, which is why the near scenarios in the table are almost linear. But stack enough cuts and the floors begin to catch loans one by one, which is why the third hundred basis points of cuts costs less income than the first. The floor schedule in a filing tells you how much natural insurance the book carries against a return to very low rates.
Third, the fee machinery interacts with rates in a way few investors notice. The manager's incentive fee, which we dissect in the next section, is charged only above a fixed hurdle rate, seven percent annualized at ARCC, roughly six percent at OTF. The hurdle is written in ink; the income that must clear it floats. When the Fed took rates up in 2022 and 2023, portfolio yields sailed over those fixed hurdles and the advisers enjoyed a windfall they did not underwrite for; ARCC's filing states outright that rising spreads make it easier for the adviser to surpass the hurdle. Run the film backward and you get today's tape: as SOFR falls, pre-fee income sinks toward the hurdle, and the incentive fee compresses before the dividend does, a small automatic stabilizer for shareholders and a headwind for the manager.
Put the three complications together and you can read this cycle's damage precisely in OTF's numbers, since a software lender at S plus 5.3 is about as pure a rate play as the sector offers. Its weighted-average debt yield slid to 8.9 percent, its net investment income fell from 74 cents per share in the first half of 2025 to 67 cents in the first half of 2026, and that was despite its average borrowing cost also falling, from 6.1 to 5.7 percent. The spread survived; the water level under it dropped. Remember that arithmetic when we reach the dividend that was priced off the old water level.
Who runs the fund, and how they are paid
Now the part of the filing we would read first if we could only read one: the fee note. BDCs come in two governance species, and the difference compounds for decades.
An externally managed BDC has no employees. It is a pool of assets steered by an outside adviser, usually a large private-credit franchise, under a management agreement. ARCC is run by an Ares affiliate, OTF by a Blue Owl affiliate. An internally managed BDC hires its own staff and pays salaries instead of fees; PFX has run internally since 2021, and Main Street Capital, whom we will meet in section fifteen, is the sector's most celebrated internal shop. Internal management tends to be dramatically cheaper at scale, because salaries do not grow in lockstep with assets. External management is the dominant model anyway, because the sponsors who create BDCs are, unsurprisingly, in the business of collecting fees.
The external fee has three parts, and ARCC's version is the industry's template. Part one is the base management fee: 1.5 percent a year on total assets, stepped down to 1.0 percent on assets financed with leverage beyond one-to-one. Read that carefully: total assets, not net assets. The manager is paid on the borrowed money too. A BDC with $10 of equity that borrows $10 more pays the fee on $20, which means the act of levering the fund raises the manager's revenue whether or not it raises yours. It is the oldest conflict in asset management, printed in plain sight, and the 2018 leverage law made it bigger.
Part two is the income incentive fee, and here we need to slow down, because almost nobody actually works the mechanism. ARCC's adviser earns 20 percent of pre-incentive-fee net investment income, but only in quarters where that income clears a hurdle of 1.75 percent of net assets, seven percent annualized. Sounds shareholder-friendly. The catch is the catch-up: between the 1.75 percent hurdle and 2.1875 percent, the adviser takes one hundred percent of every incremental dollar, until it has collected a full 20 percent of the whole amount, as if the hurdle never existed. Only above 2.1875 percent does the split settle into 80/20. Here is the arithmetic per hundred dollars of net assets in a single quarter:
| Pre-fee income (qtr, per $100 of net assets) | Zone | Adviser's fee | You keep |
|---|---|---|---|
| $1.60 | Below the hurdle | $0.00 | $1.60 |
| $1.90 | Catch-up: adviser takes 100% | $0.15 | $1.75 |
| $2.1875 | Catch-up complete | $0.4375 | $1.75 |
| $3.00 | Above: 80 / 20 split | $0.60 | $2.40 |
Part three is the capital gains incentive fee, 20 percent of cumulative net realized gains, netted against realized losses and unrealized depreciation since inception, trued up annually. Because it is cumulative, it can run in reverse on the accrual line: ARCC's income statement this quarter shows a negative 21 million dollar capital-gains fee accrual, the bookkeeping reversal of fees accrued in better markets. Keep that reversal mechanism in mind; it returns with a starring role in the OTF case study.
Two fine-print clauses deserve the harsh light. First, ARCC's agreement, like most, includes accrued but uncollected income, PIK interest and PIK dividends, in the income the incentive fee is charged on, and the filing states plainly that the adviser is under no obligation to reimburse fees earned on accrued income that is never actually received. The manager is paid in cash today on interest the fund may never see. Second, fee schedules are not carved in stone; they are amended at moments of convenience. When OTF listed on the exchange in mid-2025, its incentive rate stepped up, from 10 percent to 17.5 percent, on both income and gains. The private investors who seeded the fund enjoyed one fee deal; the public investors who bought the listing inherited a permanently more expensive one, disclosed in the same note. For the half-year just ended, OTF's management fees ran $107.9 million against $48.4 million in the prior-year period. The vehicle got bigger; the toll got bigger faster.
Net asset value and the three levels of fair value
Every BDC conversation eventually arrives at one ratio, price to NAV, so we should be precise about what NAV is. Net asset value is assets minus liabilities, divided by shares: the accounting liquidation value of the loan book after repaying the borrowings. The entire question is how the assets are valued, and here accounting has a candid vocabulary. Under the fair-value hierarchy, Level 1 assets are valued from quoted prices in active markets, a stock on an exchange. Level 2 assets are valued from observable inputs, a bond that trades occasionally. Level 3 assets are valued from unobservable inputs, which is a polite way of saying a model and a judgment.
A BDC's loans are made to private companies. They do not trade. They are almost all Level 3. Of ARCC's $29.3 billion portfolio, the overwhelming bulk sits in Level 3; of PFX's $302 million, about $246 million does. The marks are produced by a quarterly ritual the filings describe in identical choreography: independent valuation firms model each position, management's designated valuation officer reviews and sets the final marks under board oversight, using market yields for the loans and earnings multiples for the equity. It is a serious process, run by serious people, audited and disclosed. It is also, unavoidably, an appraisal. NAV is an opinion held by the seller. Price is a bid made by strangers. The gap between them is the market grading the appraisal.
Which is why the discount column in Exhibit A is a question, not an answer. The market grades ARCC's appraisal at roughly 96 cents on the dollar, OTF's at 63, PFX's at 52. Those are three different sentences, and the filings let you parse each one. For PFX, start with what the NAV is made of: 54.6 percent of the portfolio is equity and warrants, not loans; controlled companies the BDC itself owns make up 81 percent of net assets; the single largest position, a private insurance holding company, is 37 percent of net assets by itself, marked at a multiple of its book value; the gems-lending affiliate is carried at replacement cost. Each mark may be honest. None is checkable against a market, and the market's 48 percent haircut is its fee for taking the appraisal on faith. We will see in section thirteen that management appears to agree with the market, and is acting on it, shrewdly.
Anatomy of a single loan
Time to open the glass case. The heart of every BDC filing is the consolidated schedule of investments, the loan-by-loan census, and the skill of reading a BDC is mostly the skill of reading its rows. Here is a real one, lightly reformatted, from OTF's schedule this quarter:
Multiply that row by six hundred nineteen and you have ARCC. The census also aggregates upward into the summaries we have been quoting all along: portfolio mix by seniority, by industry, by rate type, weighted-average yields, floor coverage. Two aggregations deserve special attention every quarter. The first is seniority mix, because it is the honest label on the risk jar: OTF at 78 percent first lien is a different animal from PFX at 40 percent loans and 55 percent equity, whatever their yields suggest. The second is the set of footnote flags, because a loan's troubles appear in the superscripts a quarter or two before they appear anywhere else.
Income quality: the trouble with PIK
Now we can grade the income itself, because not all of a BDC's revenue is the same substance. The income statement splits investment income into cash interest, dividend income, fee income, and a category that deserves its own section of this masterclass: PIK, payment in kind.
PIK interest is interest paid not in cash but in more loan. The borrower's balance grows by the coupon; the BDC books the growth as income today and hopes to collect it at maturity. Under RIC rules the BDC must even distribute that phantom income in real cash to shareholders, which means PIK-heavy BDCs are paying out money they have not received against loans that are compounding in size. Whether that is alarming depends entirely on why the PIK exists, and this is a distinction the filings let you draw. Underwritten PIK is structured at origination, common in software lending where a growing borrower prefers to reinvest cash flow; the lender prices it and chose it. Amendment PIK is different: a loan that began life cash-pay and was converted to PIK mid-stream is usually a borrower who could not make the cash payment, dressed in paperwork. Same accounting line, opposite meanings.
The exhibit holds a small surprise: the giant, diversified, investment-grade-rated ARCC runs more paper income than the young tech lender, 15.5 percent of revenue against 12.8. The composition explains it. Nearly half of ARCC's PIK is PIK dividends on preferred equity it holds alongside its loans, structures where deferral is the design, not the disease. This is why we keep hammering one habit: never stop at the ratio. Two funds with identical PIK percentages can be one healthy portfolio of underwritten deferrals and one infirmary of amended loans.
And when PIK goes wrong, it goes wrong in a particular, instructive way, and PFX's schedule contains the perfect specimen. Its restaurant borrower, NVTN, owes a Term Loan C priced at SOFR plus 12 percent, all PIK. The loan's par balance, swollen by years of capitalized interest, stands near $11.5 million. Its carrying cost is $7.6 million. Its fair value is zero. Every dollar of that compounding coupon was booked as income in some past quarter, taxed, distributed, and the asset behind it has now evaporated. The loan is on non-accrual, PFX's only one, and it is the entire PIK cautionary tale in a single row: paper income is real income only if the paper is eventually worth something.
Seeing credit trouble early
Credit losses in a BDC almost never arrive as surprises. They arrive as a procession, visible in the disclosures for quarters before they reach the income statement, and this section is the parade route. We watch five markers, in the order they usually light up.
First, the internal ratings drift. Every BDC grades each position on an internal scale and publishes the distribution. Trouble shows up as migration: the middle grades bleeding into the watch grades quarter over quarter, long before anything defaults. One warning about the scales themselves, though, and it is embarrassingly practical:
| Fund | Scale | Best grade | Worst grade | New loans start at |
|---|---|---|---|---|
| ARCC | 1 – 4 | 4 | 1 | 3 |
| OTF | 1 – 5 | 1 | 5 | 2 |
| PFX | 1 – 5 | 1 | 5 | 2 |
Read with the legends, the quarter's distributions are calm: ARCC's two worst grades hold 5.4 percent of fair value, OTF's three watch-and-worse grades hold 7.6 percent and actually improved from year-end, PFX has 8.4 percent on watch and nothing below it.
Second, non-accruals, measured both ways. When collection becomes doubtful, a loan goes on non-accrual: income recognition stops. Filings report the bucket two ways, and the pair says more than either number. At cost tells you how much was lent into the problem; at fair value tells you what the marks say is left. OTF's non-accruals are 0.6 percent of the book at cost but 0.1 percent at fair value, $87.7 million lent, $20.0 million remaining, which means the damage is largely already carved into NAV; the future realized loss is mostly pre-taken. A fund whose non-accruals are large at cost and still large at fair value is telling you the pain is ahead of it, not behind. Watch formation, too, the arrival of new names: OTF added one new non-accrual this quarter, its second, off a pristine base.
Third, PIK conversions. This is the amendment species from the previous section, and PFX's filing happens to contain a live one, visible only if you compare quarters. Its loan to a veterans-services borrower appears in the September 2025 schedule as a 12 percent cash-pay term loan. In the June 2026 schedule the same loan reads 10 percent cash plus 4 percent PIK. No press release accompanies such a change; the coupon quietly grew while the cash component shrank, and the fair-value mark on the position slipped alongside it. Diffing the schedule of investments across quarters is tedious, and it is precisely where the earliest information lives.
Fourth, amendments and extensions. Maturity dates that walk backward, fee income spiking from amendment fees, footnotes noting extended terms: each is a borrower that could not perform on the original contract, renegotiated before it became a statistic.
Fifth, the dividend's own coverage trend, because the board sees the portfolio from inside, and the distribution policy is the board thinking out loud. Which brings us to the most misread disclosure in the sector.
The dividend architecture
A BDC dividend is not one thing. The modern convention, adopted across the industry when rates began moving violently, is a two-part architecture, and the parts carry different promises.
The base dividend is the board's stated floor, the amount it believes the portfolio can earn through a cycle, including after the Fed takes the water level down. Boards defend the base; cutting it is a public confession. The supplemental dividend is everything above the floor: the windfall from high SOFR, from prepayment fees, from a hot quarter, explicitly labeled variable so it can vanish without ceremony. A well-run BDC in the high-rate years paid a sustainable base and passed the excess through as clearly-labeled supplementals, exactly so that the coming cuts would shrink the supplement rather than break the promise. There is also a quieter tool, spillover: taxed-but-undistributed income carried forward as a reserve, a dividend battery for lean quarters.
So the analysis of any BDC's payout is three questions asked in order. Is the base covered by net investment income, now and at the forward SOFR curve, not last year's? Is the supplemental labeled honestly as weather, or is it being leaned on as structure? And is there spillover behind the base, or is the board defending a number with no reserve? Screens compress all of this into a single trailing yield, which is how the sector's traps get set. The two case studies that follow are both, at bottom, dividend-architecture stories, told in opposite directions: one fund whose payout is bigger than its earnings, and one whose payout is almost nothing at all while its earnings are real.
Case study: OTF, a discount that is earned
Blue Owl Technology Finance lends first-lien, floating-rate money to large software companies: recurring-revenue borrowers, 78 percent first lien, average spread of 5.3 percent over SOFR. It came to the public exchange in mid-2025 — the listing playbook we walked through in How the Pie Gets Cut — after absorbing its sister fund in a merger that spring. Its credit book, as we have seen, is close to immaculate: two non-accruals, a tenth of a percent of fair value, 92 percent of the book in its top two grades. And its shares have been a catastrophe. In the first half of 2026 alone, OTF's total return at the market price was negative 23.6 percent, and it closed the quarter at $10.35 against a $16.48 NAV, 63 cents on the dollar. A pristine lender at a near-forty-percent discount, screening at a mid-teens yield, is the kind of thing value investors dream about. We disclose here what we will repeat at the end of this piece: our Cash Flow model portfolio owned OTF, and we removed it on August 3, 2026. This section is the reasoning, in full, from the filing.
Start with the dividend that produces the screen yield, and read it from the declaration table rather than the marketing:
| Declared | Type | Record date | Payment date | Per share |
|---|---|---|---|---|
| Feb 18, 2026 | Base | Mar 31, 2026 | Apr 15, 2026 | $0.35 |
| May 5, 2026 | Base | Jun 30, 2026 | Jul 15, 2026 | $0.35 |
| Jun 2, 2025 | Supplemental | Sep 22, 2025 | Oct 7, 2025 | $0.05 |
| Jun 2, 2025 | Supplemental | Dec 23, 2025 | Jan 7, 2026 | $0.05 |
| Jun 2, 2025 | Supplemental | Mar 23, 2026 | Apr 7, 2026 | $0.05 |
| Jun 2, 2025 | Supplemental | Jun 22, 2026 | Jul 7, 2026 | $0.05 |
| Jun 2, 2025 | Supplemental — final | Sep 21, 2026 | Oct 6, 2026 | $0.05 |
Sit with what that table says. The supplemental is not a policy that responds to earnings; it is a countdown that was wound up on listing day and stops, contractually, this October. Whatever function it served — and a fixed dividend schedule announced alongside a listing serves an obvious one — it tells you nothing about the portfolio's earning power, and in eight weeks it tells you nothing at all. Any yield screen that includes those nickels is quoting a dividend that has already been discontinued.
So set the supplemental aside and test the base. The base is $0.35 a quarter, $0.70 for the half. Net investment income for the half was $0.67. The floor is already not covered, and the half-year figure flatters the trend: first-quarter NII of roughly $0.37 was propped up by a $10.7 million reversal of previously accrued incentive fees, the accrual mechanism from section six running backward after the quarter's unrealized losses. The clean read is the second quarter standing alone: NII of $0.30 against the $0.35 base, 86 percent coverage, on a book that reprices downward with every Fed cut and a fee schedule that stepped up at listing from 10 percent to 17.5 percent. Nothing in that arithmetic is hidden; all of it is in the filing; none of it survives contact with a screener.
Now the exercise your screener will never run, and the single most useful habit this masterclass can leave you with: normalize the yield before you compare it.
This is the whole thesis in one picture. The 40 percent discount is not the market failing to notice a pristine lender. It is the market repricing the shares until the dividend that will actually survive looks competitive: cut the base to what the second quarter earned, roughly $1.20 a year, and at $10.35 the stock yields 11.6 percent, which is simply the going rate for BDC risk. The price has already done the arithmetic the dividend announcement has not. Meanwhile an investor who buys "cheap at 0.63 times NAV" is implicitly claiming the fund is worth NAV, where its covered yield would trail ARCC's by well over a point, on lower-yielding collateral, under a fee agreement that got more expensive the day the public was invited in. The credit is immaculate. The discount is still earned. Cheapness is not where the price sits relative to the appraisal; it is where the durable cash flow sits relative to the price, and by that test the bargain evaporates.
We would happily revisit the name when the base resets to a covered level or the fee drag eases; management, to its credit, has been repurchasing shares at the discount, which added a dime per share to NAV this half. But we do not own listing-season dividends on the hope that the music continues. The declaration table told us when the music stops.
Case study: PFX, a BDC with almost no dividend
Now the mirror image: a BDC whose problem is not that it pays out more than it earns, but that it earns real money and pays out almost none of it, entirely legally, and — once you see what it is doing instead — rather sensibly.
PhenixFIN is the survivor of one of the sector's cautionary tales. It began life in 2011 as Medley Capital, an externally managed BDC whose adviser collected its fees while the portfolio compounded downward; the wreckage is still on the balance sheet as an accumulated deficit of $543 million against $158 million of remaining net assets. In 2021 the fund fired the structure itself: it internalized management, renamed, and began operating less like an income vehicle and more like a tiny holding company working out of a bad decade. Today its portfolio is 40 percent loans and 55 percent equity; its controlled companies equal 81 percent of net assets; its largest position is a private insurance holding operation equal to 37 percent of net assets on its own.
| PFX, nine months ended June 30, 2026 | Per share |
|---|---|
| Net investment income (GAAP) | $2.51 |
| Distributions declared | $0.07 |
| NAV added by buying back its own stock | +$1.22 |
| NAV subtracted by the portfolio (realized, unrealized, taxes) | −$2.21 |
| Net asset value per share, June 30, 2026 (vs. $80.24 at fiscal year start) | $81.69 |
Two dollars and fifty-one cents earned; seven cents paid. How is that a BDC? Recall the exact wording of the bargain from section two: the 90 percent rule binds taxable income, and taxable income is a different animal from GAAP net investment income — different expense treatment, different timing, income trapped in taxable subsidiaries, a decade of loss carryforwards doing their quiet work. PFX's own dividend note says the nine months' seven-cent special was derived from net investment income determined on a tax basis. That is the whole answer: the tax meter, which is the only meter the law reads, barely turned. The fund has even stumbled on the rule itself — its filings disclose that it failed the 90 percent distribution test for fiscal 2023 and filed the corrective form with the IRS. The letters B-D-C, standing alone, promised its shareholders nothing.
What management does instead of paying dividends is the instructive part. Since 2021 it has repurchased 29 percent of the company's own shares at an average price near $41 against an NAV above $80. Buying dollars for 52 cents is wildly accretive arithmetic — this year's repurchases added $1.22 per share to NAV, more than the entire portfolio subtracted — and if you believe the marks, it is one of the best capital allocations available anywhere in the sector. That conditional is doing heavy lifting. The NAV being repurchased against is the Level 3 appraisal from section seven: an insurance holdco at a book-value multiple, a gems-lending business at replacement cost, a restaurant group whose equity and PIK loan are both marked at zero. The market prices the whole at half the appraisal precisely because none of it can be checked. So PFX is best understood not as a broken income vehicle but as a closed-end bet on its own appraisal, run by people who keep taking the bet with the shareholders' money. That may even be a good bet. It is simply not the product anyone typing "BDC dividend yield" into a screener believes they are buying, and the fund's nine-month total return at the market price, negative 10.5 percent, suggests its shareholder base is still working that out.
Set the two case studies side by side and the lesson sharpens. OTF trades at 63 cents because its dividend overstates its earning power. PFX trades at 52 cents because its NAV may overstate its assets, and it pays essentially no dividend at all. Same wrapper, same discount neighborhood, opposite diseases — and a screener sorting on yield would rank one at the very top of the sector and drop the other off the list entirely, learning nothing true about either.
Valuation: price to NAV is shorthand for return on equity
By now you can feel that price-to-NAV, the sector's universal valuation ratio, is really a compressed claim about earnings. Let us uncompress it.
A BDC is a pool of capital earning a return on its equity and paying most of that return out. If a fund reliably earns a 10 percent return on its NAV, and investors require a 10 percent return for BDC risk, the fair price is NAV: buy at 1.0 times, earn 10 on 10. If the fund can only earn 8 while investors demand 10, no one will pay full freight; the price falls until the buyer's yield reaches the required return — which lands the stock at a durable discount of roughly eight-tenths of NAV. The persistent discounts that litter the sector are not, for the most part, inefficiencies. They are the market solving one line of algebra:
Run our specimens through it. ARCC earns roughly a 10 percent ROE — a $0.50 quarter of NII on a $19.35 NAV — pays a covered $1.92, and trades within a few percent of NAV: the algebra closes. OTF's covered earning power at the Q2 run-rate is closer to 7 percent of NAV, and the shares sit at 0.63 times: the algebra closes there too, uncomfortably. And the rare BDCs that trade at persistent premiums are the ones the market believes earn returns on NAV that ordinary lending cannot explain — which is our bridge to the last mechanic of this masterclass, because how a BDC earns an extraordinary ROE is a choice about what it owns.
Allocation: what a BDC chooses to own
Everything to this point has treated a BDC as a lender. The last mechanic is that "BDC" is a wrapper around an allocation decision, and the sector quietly spans an entire spectrum, from pure senior lender to something close to a private-equity compounder. Where a fund sits on that spectrum explains its yield, its volatility, its fee justification, and — as the premium names prove — its long-run outcome more than anything else in the filing.
At one end sits OTF: 78 percent first lien, the utility model. Senior loans have a ceiling — par plus the coupon is the best case on every position — so the fund's return is its spread minus its losses minus its fees, full stop. The model's virtue is that the ceiling is also close to the floor; its curse, as we saw, is that the entire proposition floats on SOFR and the fee load decides how much of the spread survives to shareholders.
In the middle sits ARCC, a lender with a portfolio of side bets: 59 percent first lien, then layers of subordinated debt, preferred equity paying those PIK dividends, and — most interesting — an entire wholly-owned asset-management firm, Ivy Hill, carried at $2.8 billion, managing $16.3 billion of outside capital and paying distributions back to the BDC that the filing computes at a 16-to-18 percent yield on its carrying value. A meaningful slice of ARCC's return does not come from lending at all; it comes from owning a business that feeds on the same ecosystem. That is what a mature allocator does with two decades and permanent capital.
At the far end stands the sector's great outlier, Main Street Capital, ticker MAIN — internally managed, and the clearest proof that allocation is destiny. Its 10-Q covers the same June 30, 2026 quarter as our three specimens, and it reads like a different industry: MAIN holds equity in every single one of its lower-middle-market portfolio companies — an average fully diluted stake of 36 percent — alongside its own loans to them, 99 percent of which sit at first lien. The design gives every underwriting three ways to win — interest on the loan, dividends from the business as it grows, and appreciation on the equity — and the compounding shows up exactly where this masterclass has taught you to look: that lower-middle-market book is carried $658 million above its cost, about $7 per share of a $33.92 NAV that lending alone could never have produced, and the shares have commanded roughly one and a half times NAV for years while most of the industry begs for 1.0. Run the algebra from section fourteen in reverse and MAIN's premium is not sentiment; it is the market capitalizing an ROE that a pure lender cannot reach, delivered through an internal cost structure that does not tax the excess away.
And then there is the cautionary bookend: PFX also holds a majority-equity portfolio — 55 percent — and trades at half of NAV. The difference is the whole lesson. MAIN's equity is minority stakes in growing companies it also lends to, born of underwriting, marked against a long public record of realized gains. PFX's equity is control positions inherited from restructurings — the things a lender ends up owning when loans die — marked by appraisal, with a zeroed restaurant group in the case file. Equity allocation in a BDC is leverage on the manager's judgment: it built MAIN's premium and it dug the hole PFX is still climbing out of. When you open a new BDC's filing, the seniority-mix table is where you learn which movie you are in.
The twenty-minute checklist
You now know how the machine works. Here is the whole masterclass compressed into the five numbers we pull, in order, from any BDC's latest 10-Q — a twenty-minute exercise, all of it in the filing, none of it in a screener — shown as we would fill it in for this quarter's three specimens:
| The five numbers | ARCC | OTF | PFX |
|---|---|---|---|
| 1 · Coverage: NII vs. dividends declared (latest qtr) | $0.50 vs $0.48 — 104% | $0.30 vs $0.35 base — 86% | $2.51 vs $0.07 (9 mo) |
| 2 · Non-accruals, at cost / at fair value | 2.4% / 1.4% | 0.6% / 0.1% | 2.3% / 0.0% |
| 3 · PIK, % of investment income (and which species) | 15.5% — mostly structured pref. dividends | 12.8% — mostly underwritten | ≈7.6% — incl. one zeroed PIK loan |
| 4 · Yield at NAV, regular dividend only | 9.9% | 8.5% (pre-cut) | ≈0% |
| 5 · Fee load and structure | External — 1.5% base + 20% over 7% hurdle | External — 1.5% base + 17.5% over 6% hurdle | Internal — salaries |
Use it in sequence. Coverage tells you whether the dividend is earned. Non-accruals, both ways, tell you whether losses are behind the marks or ahead of them. The PIK line, chased into the footnotes, tells you how much of the income is paper and of which species. Yield at NAV, regular dividend only, is the great normalizer — it strips out the discount's flattery and the supplementals' noise and lets every BDC be compared to every other on the only basis that matters, durable cash against fair value. And the fee note tells you who is standing between the portfolio's return and yours, and how wide their stance is. Twenty minutes, four times a year. The glass case is open; this is the order in which to read it.
The takeaway
A business development company is a promise of disclosure, not a promise of yield. The wrapper compels a payout ratio on taxable income, quarterly publication of every loan, and hard walls on leverage — and it compels nothing else. Within those walls live utility lenders and equity compounders, immaculate credit books with broken dividends and battered holding companies with pristine coverage of payouts they barely make. The ticker suffix tells you none of this. The filing tells you all of it.
The sector's traps are built from its own virtues. Because the assets float on SOFR, yesterday's yield is an artifact of yesterday's Federal Reserve. Because the discounts are public, cheapness gets mistaken for value when it is usually the market grading either the earnings or the appraisal, and grading them correctly. Because the income arrives as a single smooth dividend, nobody asks which parts of it are spread, which are windfall, which are paper, and which are a countdown that was wound on listing day. Every one of those questions is answerable in twenty minutes, from documents filed under oath, for free.
We went through three of them with you: the benchmark that earns its price, the immaculate lender whose discount is deserved, and the half-price appraisal paying seven cents. Three animals, one quarter, one lesson. The yield is the advertisement. The 10-Q is the product. Read the product.
See it yourself: every filing quoted here is free on EDGAR — ARCC's 10-Q filings, OTF's, and PFX's. Open the June 30, 2026 quarter of each and follow along with the checklist. For the sibling concept of return of capital in high-yield funds, our earlier piece is here.
Disclosure: one or more of our model portfolios hold positions in business development companies, and companies discussed here have appeared in the portfolios; subscribers receive every position and every change as it happens. The Cash Flow model portfolio removed OTF on August 3, 2026, for the reasons set out above. Nothing here is individualized investment advice. Our full Disclosure Policy applies.
Tools we use — see our full toolkit (some links earn us a commission).
This is how we reason.
The memos apply the same standard of proof to three live model portfolios — every position change explained, every month.